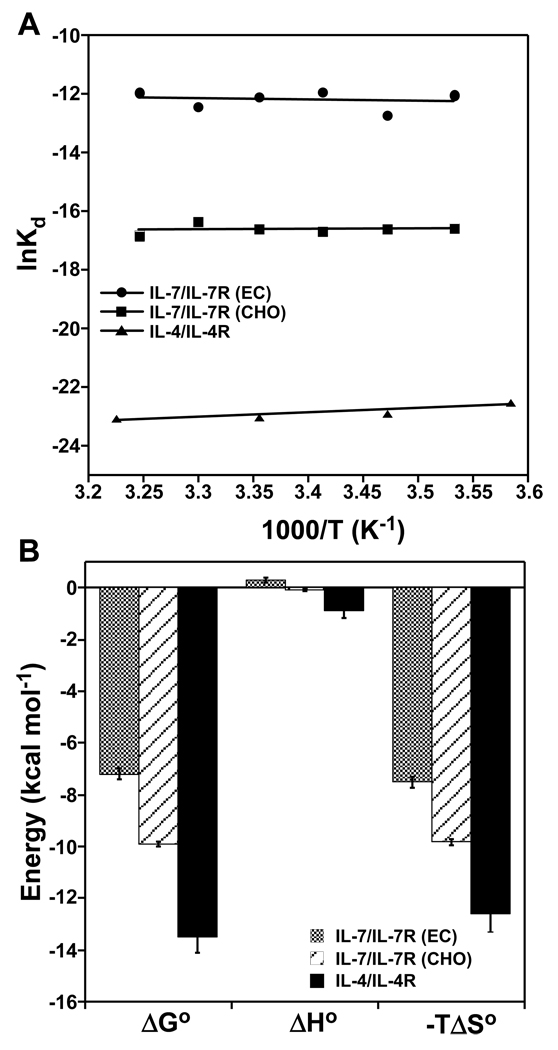
Figure 5.
Equilibrium binding constants of IL-7 to nonglycosylated and glycosylated IL-7Rα and IL-4 to IL-4Rα as a function of temperature at 150 mM NaCl and pH 7.4. (A) van't Hoff analysis plotted as lnKd versus 1/T (K−1). Data fit well using linear regression for nonglycosylated IL-7/IL-7Rα (EC, filled circles), glycosylated IL-7/IL-7Rα (CHO, filled squares), and IL-4/IL-4Rα (filled triangles). (B) Bar graphs of the equilibrium thermodynamic parameters obtained from van't Hoff analysis for these interactions. These parameters are listed in Table 2. The ΔGo values are reported at 298 K.

