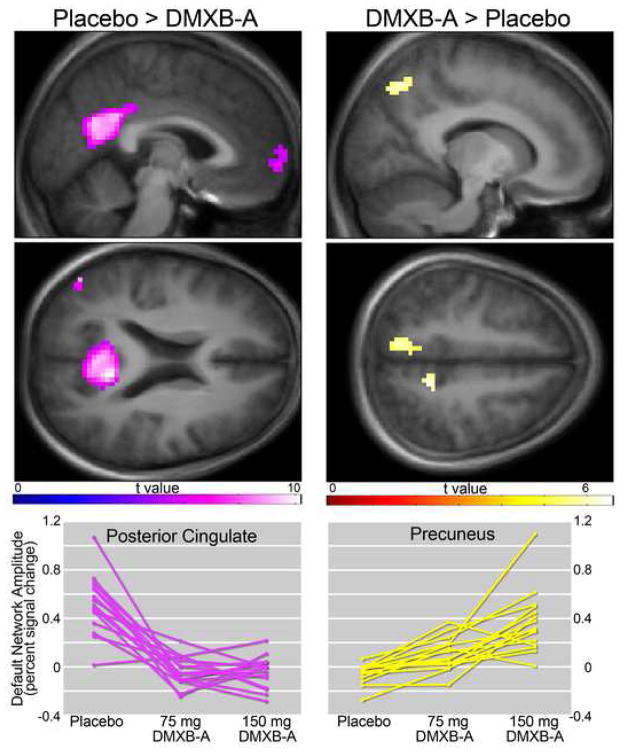
Figure 1.
Effects of DMXB-A on default network activity. Left panels indicate regions that showed reduced activity following administration of drug (collapsed across drug dose), compared to placebo administration. Right panels show areas of greater activity. Statistical maps thresholded at p < 0.05, FWE corrected. Data are shown in the radiological convention (R on L). Individual subject responses are shown in bottom panels.

