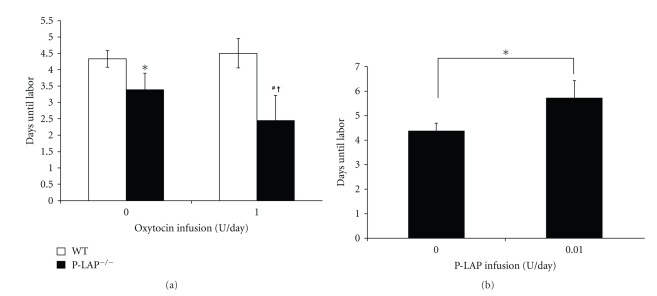
Figure 3.
(a) Effect of OT infusion on the pregnant time in both WT and P-LAP KO mice. Values are expressed as means ± SD. *P < .05; WT mice versus P-LAP KO mice in vehicle only, #P < .05; WT mice versus P-LAP KO mice in 1 U/day OT, †P < .05; P-LAP KO mice in vehicle versus P-LAP KO mice in 1 U/day OT. (b) Effect of recombinant P-LAP on the pregnant time in WT mice. Values are expressed as means ± SD. *P < .05; vehicle only versus 0.01 U/day P-LAP.

