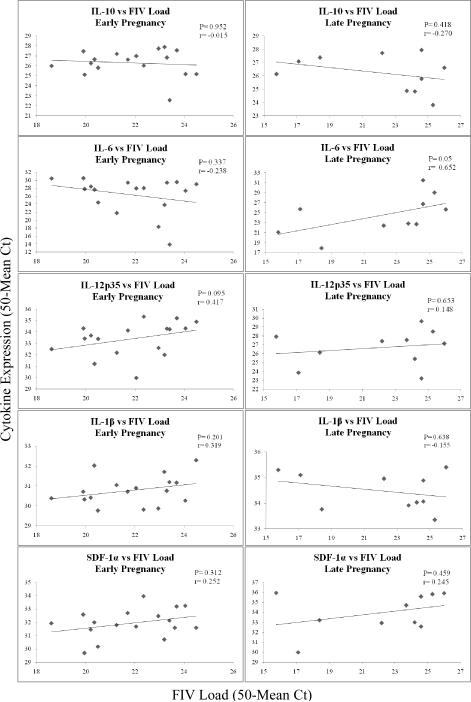
Figure 6.
Correlation of FIV Load and Cytokine Gene Expression in Individual Placentas Obtained from FIV-infected Queens at Early and Late Pregnancy.
Adjusted mean Ct values (50-mean Ct) for FIVgag sequence (X) amplified from individual placental tissues were correlated with adjusted mean Ct values for cytokines (Y) amplified from the same tissues. Individual XY data points are plotted on scatter charts, and trend lines are shown. The data were analyzed using Spearman Rank Correlation. P ≤ 0.05 was considered significant.

