
Figure 2. MiR-31 relative expression levels along the normal colon.
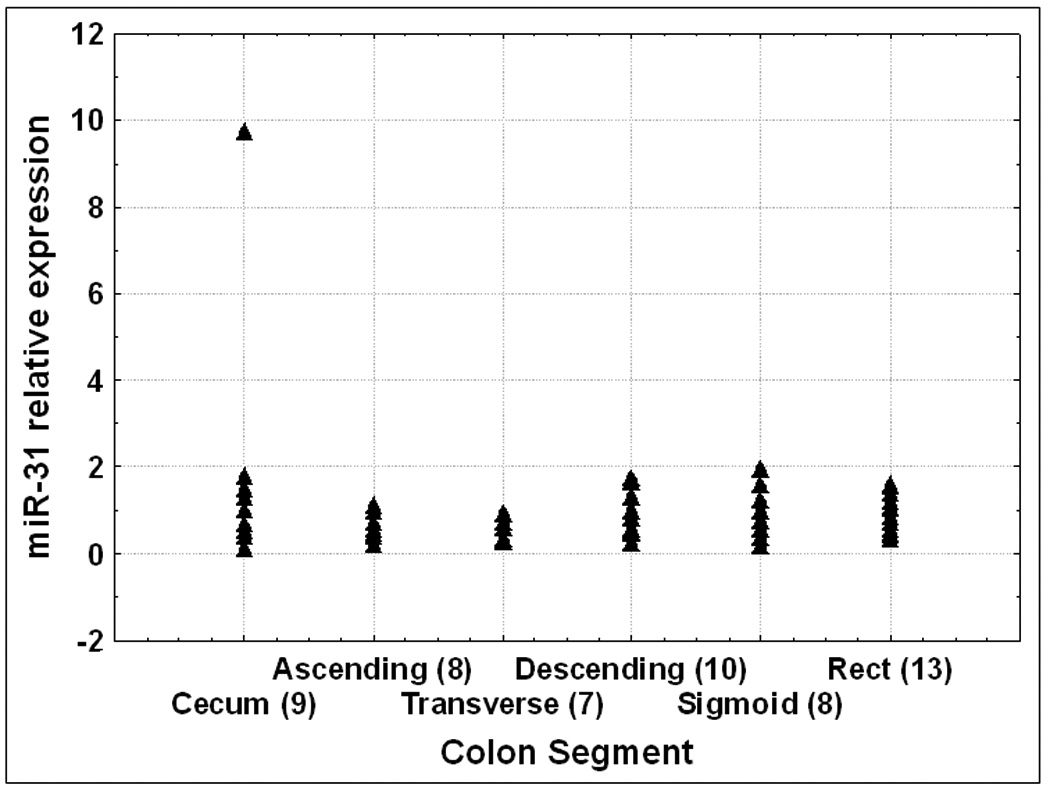
RNA was extracted from 55 normal specimens collected from patients without any history of IBD or colon cancer. qRT-PCR was performed and signal average for normal specimens was calculated. Values displayed are relative to normal average value. The numbers of specimens for each colon segment are shown in brackets.