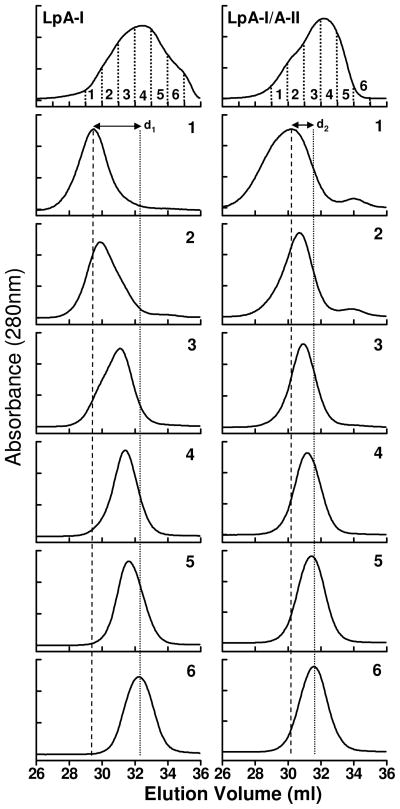
Figure 2. Size exclusion chromatography of LpA-I and LpA-I/A-II.
Chromatographic traces of LpA-I and LpA-I/A-II upon separation on two Superose 6 columns in tandem (top panel). Each main pool was divided into six individual subfractions based on the elution volume and was numbered 1–6. The individual chromatography profile of each subfraction is shown below the corresponding main pool. The distances between the largest average particle size and the smallest average particle size are shown by d1 for LpA-I and d2 for LpA-I/A-II respectively. The average size of the largest and the smallest particles are shown by vertical short dash and long dash lines respectively.

