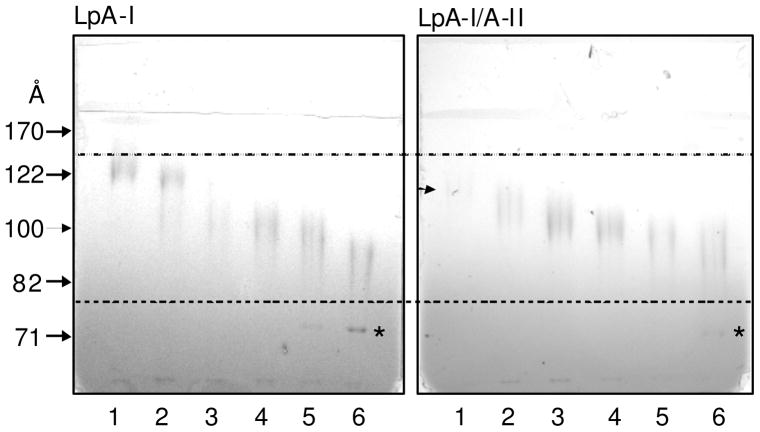
Figure 5. Native PAGE characterization of cross-linked LpA-I and LpA-I/A-II.
Individual cross-linked LpA-I and LpA-I/A-II subfractions (at 1 mg/ml total protein concentration), were used in Figure 4 were subjected to 8–25% Native PAGE analysis. The locations of the hydro-dynamic diameters of the High Molecular Weight markers are indicated by arrows. Numbering of the sub-fractions is as in Figures 2, 3 and 4. Location of the LpA-I/A-II fraction 1, which is not clear on the gel, is marked with an arrow. Location of the internally cross-linked albumin in fraction 6 of LpA-I and LpA-I/A-II pools are marked by asterisks. Gels were stained with Coomassie Blue.

