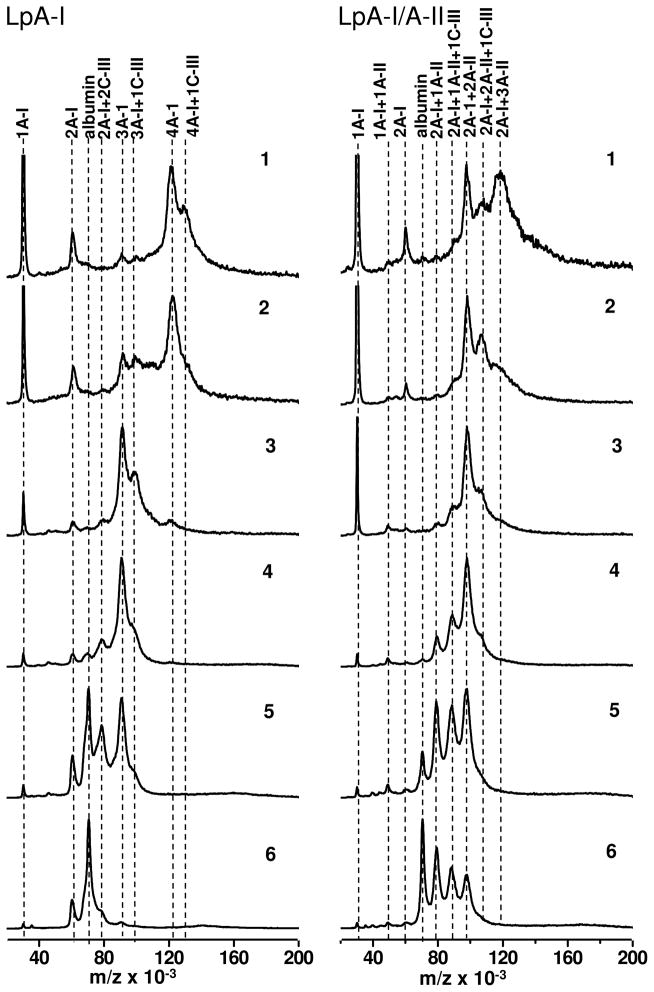
Figure 6. MALDI mass spectra of cross-linked LpA-I and LpA-I/A-II subfractions.
Individual cross-linked subfractions (shown in Figs. 4 and 5) were subjected to MALDI-MS measurements in 10–200 kDa range. Possible combinations of apolipoproteins attributable to major peaks in the MALDI spectrum is indicated above the vertical dotted lines that connects similar Mr in each spectrum. The peak location corresponds to the albumin contamination is indicated as “albumin”.

