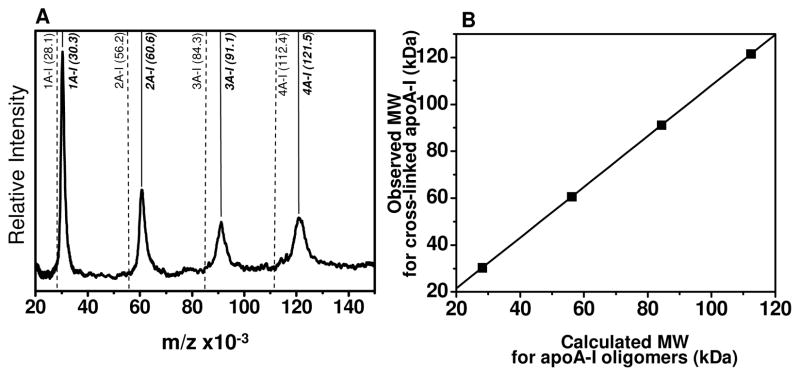
Figure 7. Linear regression between theoretical masses for oligomeric apoA-I vs observed masses for cross-linked apoA-I.
A. MALDI-MS of self associated lipid free apoA-I upon cross-linking with BS3 at 1:100 protein to BS3 molar ratio with the peak locations marked by solid lines and masses given in parentheses in Italics. Predicted Mr for non cross-linked oligomers are shown by dashed lines along with corresponding Mr in parentheses. B. Linear regression of predicted vs observed Mrs that are on panel A.

