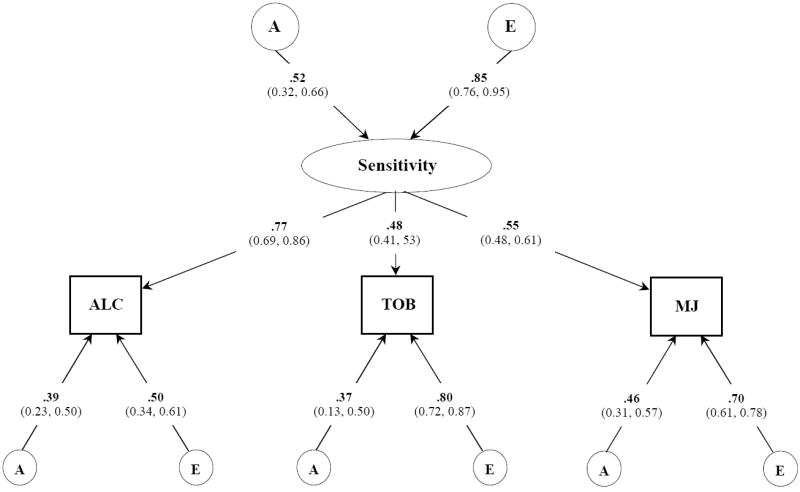
Figure 2.

Best fitting common pathway model for POSITIVE subjective effects to alcohol, tobacco, and marijuana. Variance component estimates (95% confidence intervals) are shown for the latent common factor and unstandardized path coefficients for each observed variable. A, indicates additive genetic influences; E, indicates non-additive genetic influences and includes measurement error;
