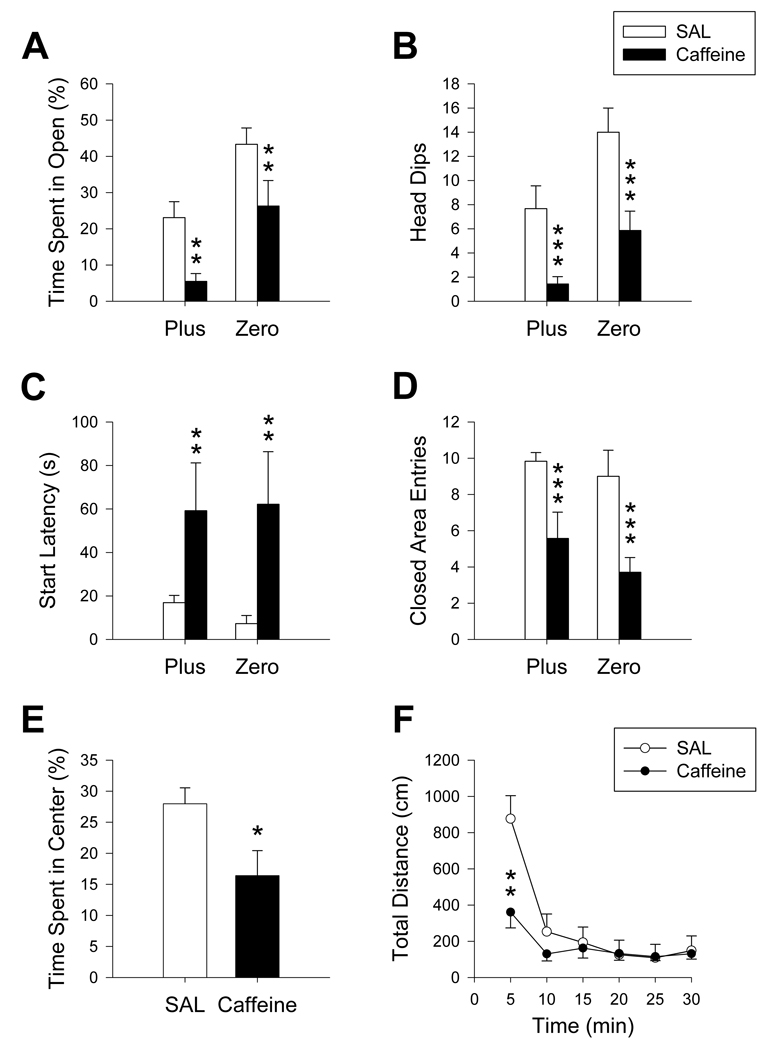
Figure 6.
Maze comparison after caffeine treatment: Decreases in percent time spent in open areas (A) and number of head dips (B) were seen following caffeine treatment. Start latencies (C) were increased in caffeine-treated animals in both mazes compared to controls while the number of closed area entries (D) decreased. In the Plus, caffeine-treated animals spent less time in the center region (E) than controls. Caffeine decreased distance traveled (F) in the first 5 min of open-field testing. *p ≤ 0.05; **p ≤ 0.01; ***p ≤ 0.001. Caffeine: N= 7/maze; SAL: N = 6/maze.

