Figure 5.
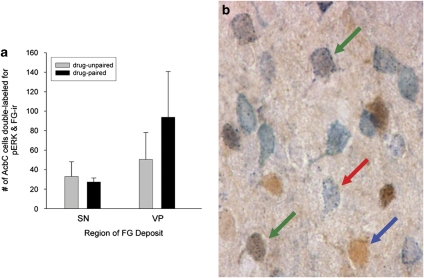
Analysis of FG-pERK double labeling. (a) Quantification of AcbC cells double-labeled for pERK- and FG-immunoreactivity (n=3 per region of deposit). (b) Examples of AcbC pERK (blue arrow), FG (red arrow), and pERK and FG (green arrows) immunoreactivity resulting from FG iontophoresis into the VP. Double labeling was evidenced by the presence of gray stippling (FG immunoreactivity) within cells that were uniformly brown (pERK+). Scale bar=100 μm.

