
Figure 4.
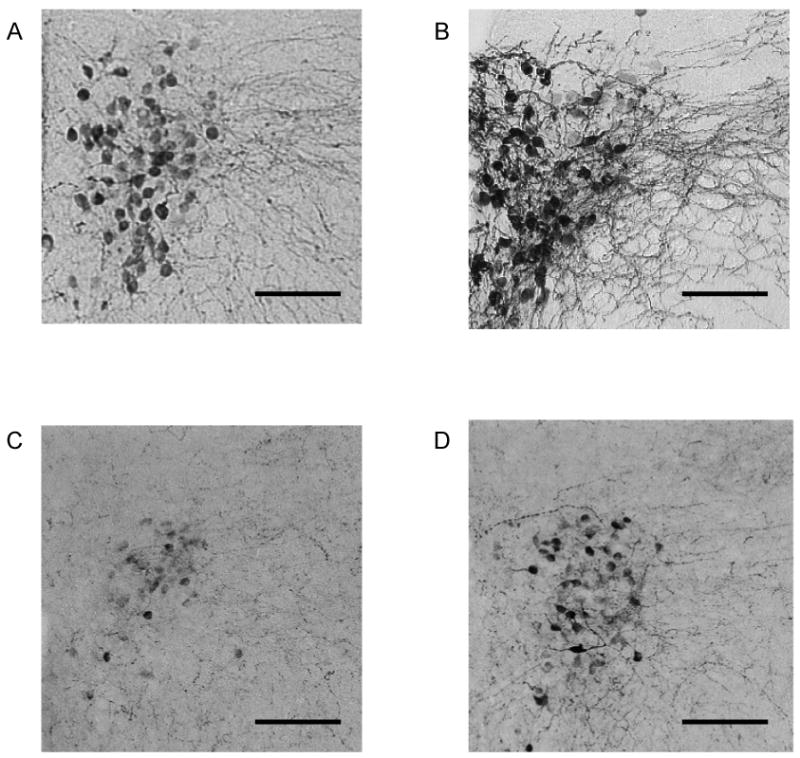
Brain sections (40 μm) showing oxytocin- (Panels A and B) and CRF-immunoreactivity (Panels C and D) in representative paired (Panels A and C) and isolated (Panels B and D) prairie voles in the hypothalamic PVN. Pictures are shown at 100× magnification. Scale bars = 100 μm. Stained fibers were excluded from analysis.