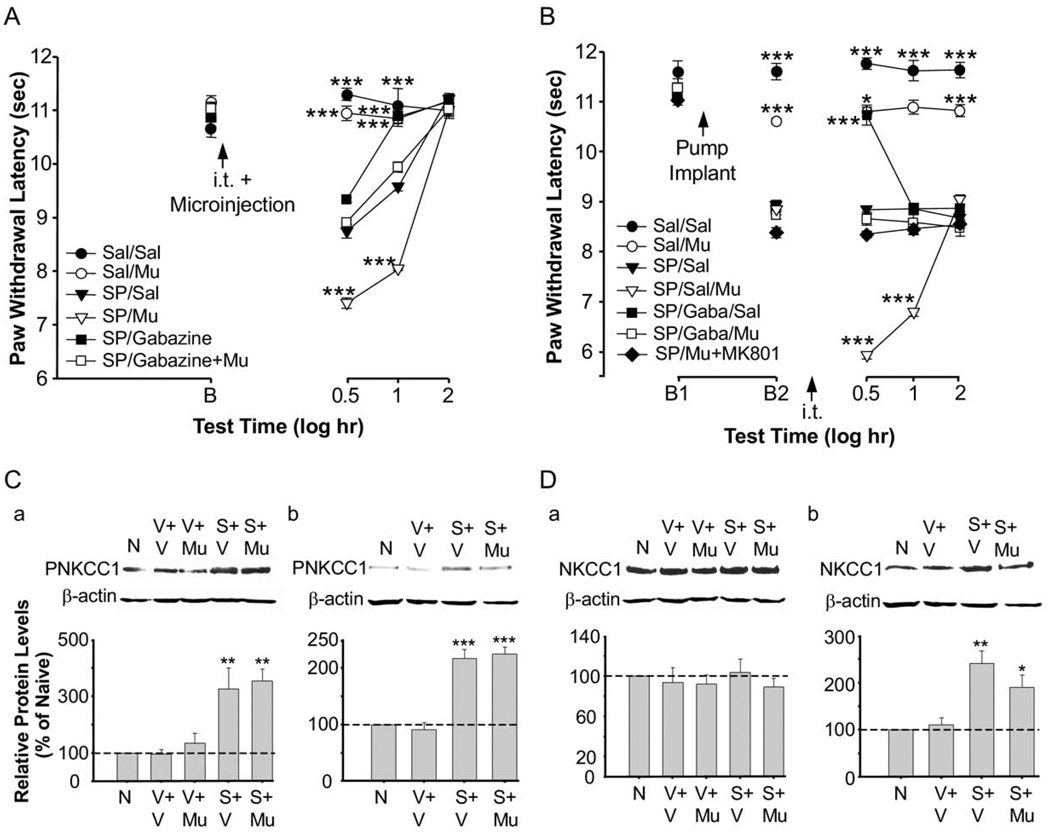
Fig. 7.
Functional interaction of RVM SP-induced GABA depolarization, NKCC1 protein and phosphorylation, and behavioral hyperalgesia. (A) Mean thermal paw withdrawal latencies (+SEM) of both paws combined for animals that received 0.1 µg muscimol, 55 µg gabazine, 55 µg gabazine+0.1 µg muscimol, or vehicle injected intrathecally prior to a 0.005 µg SP or saline microinjection in the RVM. *** P<0.001 versus SP/saline at that time point. saline/saline, n=5; saline/muscimol, n=5; SP/saline, n=6; SP/muscimol, n=5; SP/gabazine, n=5; SP/gabazine+muscimol, n=5. B represents baseline. (B) Mean thermal paw withdrawal latencies (+SEM; both paws combined) for 30–40-day old animals that received a GABAA receptor antagonist, a GABAA receptor agonist, both, or vehicle injected intrathecally following low dose chronic infusion of SP for 24 h. Doses of drugs—intrathecal: 0.1 µg muscimol, 55 µg gabazine, or saline; RVM: 0.2 ng/h SP or saline via chronic infusion. *** P<0.001 versus SP/saline at that time point. saline/saline, n=12; saline/muscimol, n=5; SP/saline, n=6; SP/saline+muscimol, n=6; SP/gabazine+saline, n=6; SP/gabazine+muscimol, n=6; SP/muscimol+MK801, n=5. B1 represents baseline and B2 represents baseline 24 h after osmotic pump implant, but before intrathecal injection. (C) Western blot analysis for NKCC1 protein phosphorylation after acute microinjection of 0.005 µg SP or vehicle (C-a) or chronic infusion of 0.2 ng/h SP or vehicle (C-b). Intrathecal injections consisted of vehicle or 0.1 µg muscimol. NKCC1 phosphorylation was increased as compared to naive animals following an intrathecal injection of muscimol combined with an acute microinjection of SP (P<0.01) or chronic infusion of SP (P<0.001). (D) NKCC1 protein was increased as compared to naive animals following an intrathecal injection of vehicle (P<0.01) or muscimol (P<0.05) in animals with a chronic infusion of SP into the RVM (D-b). This increase in NKCC1 protein was not seen in animals that received an acute microinjection of SP into the RVM (D-a.) Spinal cord tissue was collected 30 min following microinjections (C-a, D-a) or intrathecal injections in the chronic infusion groups (C-b, D-b). β-actin was used as a loading control to normalize the levels of protein in each lane. The histogram shows the mean levels of protein normalized with β-actin (n=3 per group) and expressed as a percentage of the control. The dashed line indicates the control level. N, naive; V, vehicle; Mu, muscimol; S, SP.

