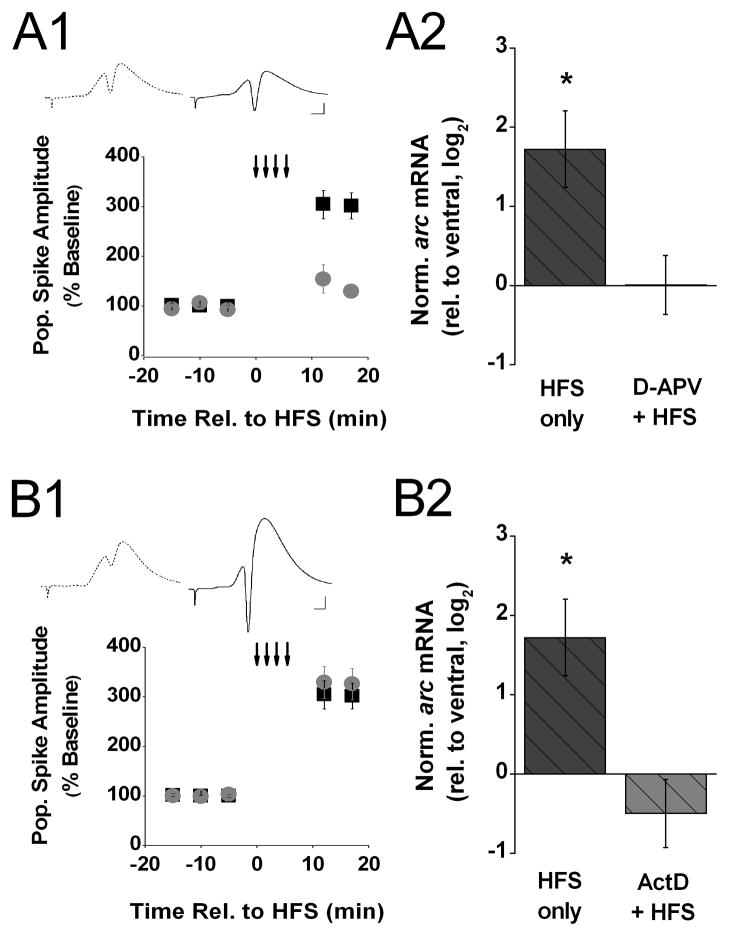
Figure 2. Increase of arc mRNA level after HFS fails to occur when either NMDA receptors are blocked or new RNA synthesis is inhibited.
A1) Means ± s.e.m.s of the amplitude of the population spike, expressed as a percent of baseline, evoked by commissural stimulation before and after 4 trains of high-frequency stimulation (HFS; small down-ward arrows) recorded from animals decapitated 20 min after HFS delivered in either the presence of D-APV (gray circles, n=6) or the absence of drug (black squares, n=7). The data from the latter group were shown in Fig. 1. A1 and are included here for purposes of comparison. Insert above shows representative waveforms (average of 10 recordings) recorded 5 min before (stippled line) and 17 min after the onset of HFS (solid line) from an animal that received HFS in the presence of D-APV. Scale: 2 mV, 2 ms. A2) Means ± s.e.m.s of arc mRNA level in dorsal area CA1 (experimental), relative to ventral area CA1 (control), detected in tissue samples harvested 20 min after HFS delivered in either the presence of D-APV (D-APV + HFS, gray bar) or the absence of drug (HFS only, black bar). The data from the latter group were shown in Fig. 1. B and are included here for purposes of comparison. Arc expression levels were normalized by gapdh expression in the respective tissue samples and, to approximate a normal distribution of the data, log2 -transformed. Fold differences (FD) can be calculated from log2(RQ) by the formula FD= 2log2(RQ). Determined Ct values for the two groups are shown in Table 1 in the Supplementary Information. Two-tailed t-tests indicate that the significant increase in arc mRNA level 20 min after HFS in the absence of drug was abolished in the presence of D-APV. B1) Means ± s.e.m.s of the amplitude of the population spike, expressed as a percent of baseline, evoked by commissural stimulation before and after 4 trains of HFS (small down-ward arrows) recorded from animals decapitated 20 min after HFS delivered in either the presence of ActD (gray circles, n=9) or the absence of drug (black squares, n=7). The data from the latter group were shown in Fig. 1. A1 and are included here for purposes of comparison. Insert above shows representative waveforms (average of 10 recordings) recorded 5 min before (stippled line) and 17 min after HFS (solid line) from an animal that received HFS in the presence of ActD. Scale: 2 mV, 2 ms. B2) Means ± s.e.m.s of arc mRNA level in dorsal area CA1 (experimental), relative to ventral area CA1 (control), detected in tissue samples harvested 20 min after HFS delivered in either the presence of ActD (ActD + HFS, gray bar) or the absence of drug (HFS only, black bar). The data from the latter group were shown in Fig. 1. B and are included here for purposes of comparison. Arc expression levels were normalized by gapdh expression in the respective tissue samples and, to approximate a normal distribution of the data, log2 -transformed. Fold differences (FD) can be calculated from log2(RQ) by the formula FD= 2log2(RQ). Determined Ct values for the two groups are shown in Table 1 in the Supplementary Information. Two-tailed t-tests indicate that the significant increase in arc mRNA level 20 min after HFS in the absence of drug was abolished in the presence of ActD.

