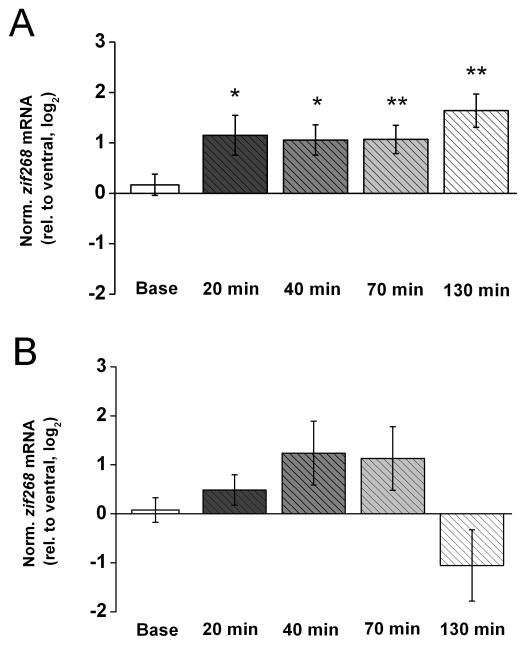
Figure 5. Zif268 mRNA levels also increase during LTP but do not change from control levels during LTD in area CA1 in vivo.
A) Means ± s.e.m.s of zif268 mRNA level in dorsal area CA1 (experimental), relative to ventral area CA1 (control), detected in the same tissue samples used in Fig. 1. B. (n = 8 for baseline (Base), n = 7 for 20 min, n = 7 for 40 min, n = 10 for 70 min, n = 10 for 130 min). Zif268 expression levels were normalized by gapdh expression in the respective tissue samples and, to approximate a normal distribution of the data, log2 -transformed. Fold differences (FD) can be calculated from log2(RQ) by the formula FD= 2log2(RQ). Two-tailed t-tests indicate a significant increase in zif268 mRNA above control level at all time points after HFS (* p < 0.05, ** p < 0.01). B) Means ± s.e.m.s of zif268 mRNA level in dorsal area CA1 (experimental), relative to ventral area CA1 (control), detected in tissue samples used in Fig. 3. B. (n = 8 for baseline (Base), n = 7 for 20 min, n = 7 for 40 min, n = 10 for 70 min, n = 10 for 130 min). Zif268 expression levels were normalized and transformed as described above. Determined Ct values for each of these groups are shown in Table 2 in the Supplementary Information. Two-tailed t-tests indicate that the variations in zif268 mRNA level after PPS do not differ significantly from control level for any of the time points.

