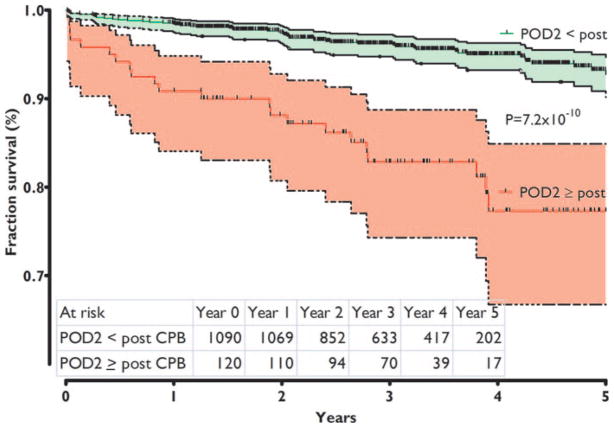
Figure 2.
Kaplan-Meier survival curve for time of peak heart-type fatty acid binding protein (hFABP) level. Difference in survival for patients with a decrease in hFABP level between POD2 and immediately after cardiopulmonary bypass (CPB) and those with an increased hFABP on POD2 compared with immediately after CPB (shaded area = 95% confidence interval). P value refers to the level of difference between curves. POD = postoperative day.

