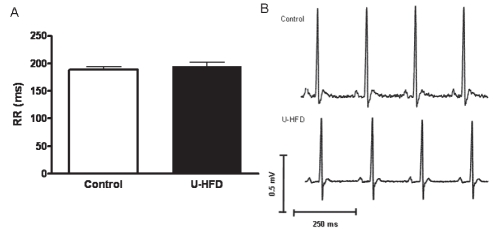
Figure 2).
Representative electrocardiograms in conscious rats. A Bar graph showing no difference in RR interval between the groups. Results are expressed as means with SEMs. B Representative traces of electrocardiograms from both groups. Control diet (n=10) and high-fat diet rich in unsaturated fatty acids (U-HFD; n=9). P>0.05 for comparison between groups

