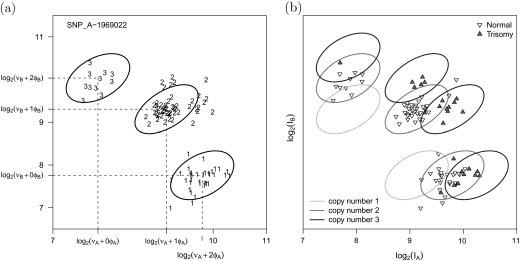
Fig 2.
Scatterplots of the A and B allele intensities for SNP_A-1969022 on chromosome 21 in the trisomy data set. (a) Our approach for copy number estimation uses naive estimates of allele-specific copy number based on the biallelic genotype calls. A weighted linear regression is fit on the intensity scale to quantile-based estimators of the within-genotype location and scale. Estimates of νA,νB,φA, and φB are locus and batch specific. The ellipses demarcate a 95% confidence region for copy number 2. (b) Prediction regions for copy number 1, 2, and 3. Plotting symbols now denote the trisomy phenotype which is not known by the regression model. Note that the prediction regions are robust to incorrect biallelic genotype calls —here, 26 of the 96 subjects had chromosome 21 trisomy and, therefore, incorrect biallelic genotypes.

