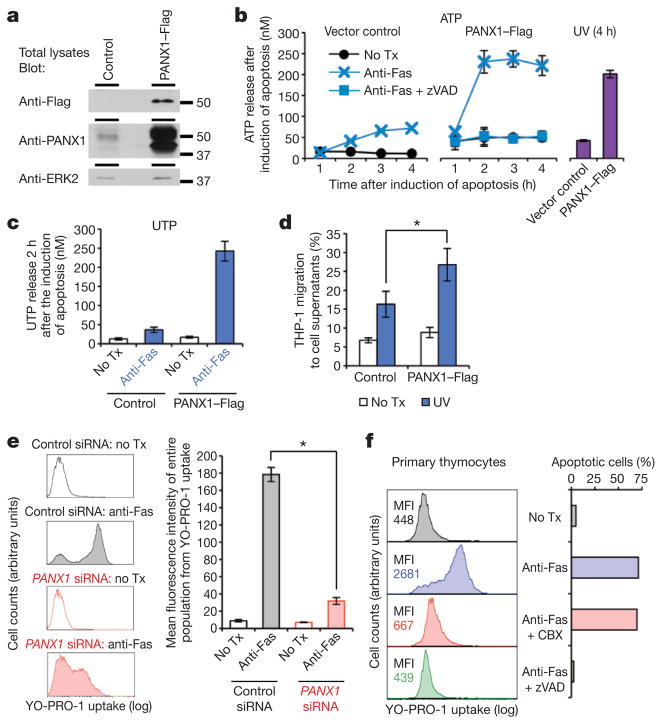
Figure 2. Pannexin 1 expression level correlates with find-me signal release and membrane permeability.
a, Immunoblotting of lysates from control or PANX1–Flag Jurkat cells. b, ATP release by Jurkat cells after induction of Fas-mediated apoptosis, and 4 h after UV-induced apoptosis. n = 2. c, UTP levels in supernatants of Jurkat cells 2 h after apoptosis induction. n = 4. d, Migration of THP-1 monocytes to supernatants from control and PANX1–Flag expressing cells, collected 2 h after induction of apoptosis. *, P < 0.05. Representative of four experiments. e, Left, flow cytometry histograms showing YO-PRO-1 dye uptake by control versus PANX1-siRNA-transfected Jurkat cells with or without apoptosis induction. Right, uptake of YO-PRO-1 presented as mean fluorescence intensity (MFI) of the entire cell population. *, P < 0.0005, n = 3. f, Left, YO-PRO-1 uptake by primary murine thymocytes undergoing anti-Fas-induced apoptosis, with zVAD or CBX treatments. Right, percentage of apoptotic cells (annexin V positive and propidium iodide negative). n = 2. Error bars represent s.d., except in c (s.e.m.).

