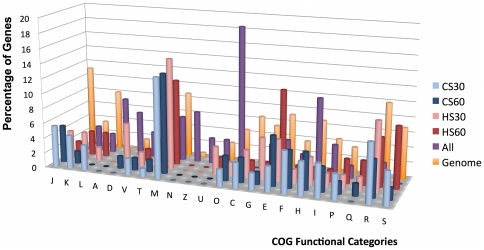
Figure 3. Functional category classification of genes differentially expressed upon exposure to stress temperatures.
(A) The figure represents the proportion of genes differentially expressed according to the COG functional classification for each condition and genes differentially expressed at least one time in all of the conditions (All).

