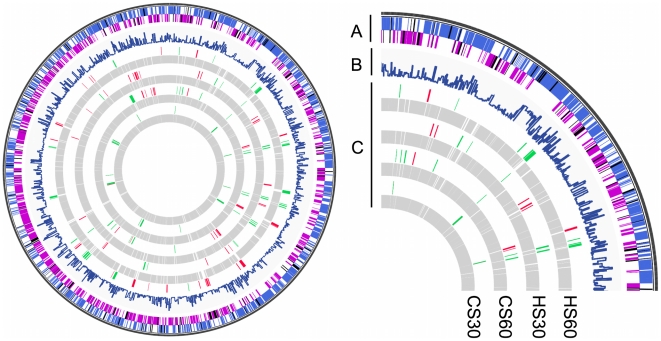
Figure 4. Transcriptional profiles of the early responses to temperature stress.
(A) The Outer circle represents the ORFing of C. burnetii genome. The blue, purple and black sections represent respectively the spotted ORF from the strand +, the spotted ORF from the strand – and the ORF not spotted. (B) The diagram represents the level of interactions with the other proteins based on String software. (C) The inner circles represent the transcriptomic profiles observed with the four tested conditions. The green, red and gray sections represent respectively the down-regulated, the up-regulated and the not regulated genes.

