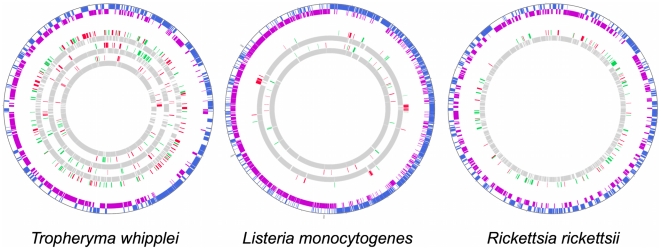
Figure 6. Transcriptional profiles from previously reported analyses of intracellular bacteria.
The Outer circle represents the ORFing of the different intracellular bacteria. The blue and purple sections represent respectively the spotted ORF from the strand + and the spotted ORF from the strand –. The inner circles represent the transcriptomic profiles observed in the different studies. The green, red and gray sections represent respectively the down-regulated, the up-regulated and the not regulated genes.

