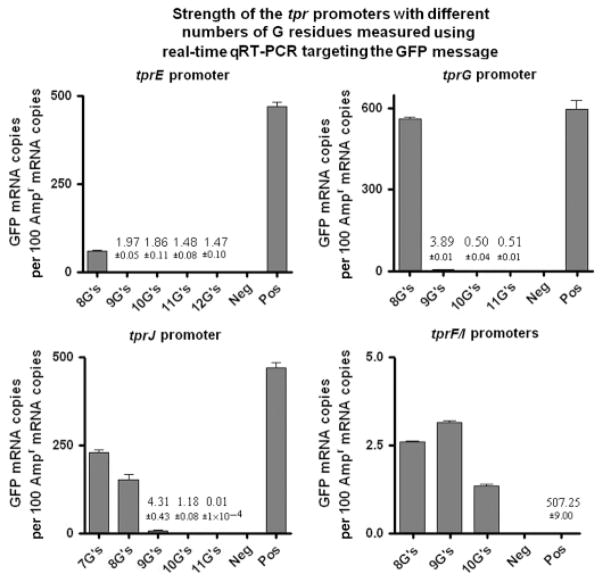
Fig. 5.
Strength of the tpr promoters containing different numbers of G residues measured by GFP quantitative real-time RT-PCR. This analysis shows for Subfamily II promoters (tprE, tprG, and tprJ) a decrease in the amount of GFP mRNA as the number of G residues increases. Similar low levels of GFP mRNA (note values on y-axis) are induced by Subfamily I promoters (tprF and tprI) regardless of the number of Gs. Values represent the means ± SE of quadruplicate measurements. Where the bars are not visible, the mean values are shown as numbers. Positive control is not shown (value reported) so that tprF/I values could be visualized. Negative and positive controls were RNA extracted from Escherichia coli cultures transformed with a promoterless pGlow-TOPO vector and lac promoter/pGlow-TOPO vector, respectively.

