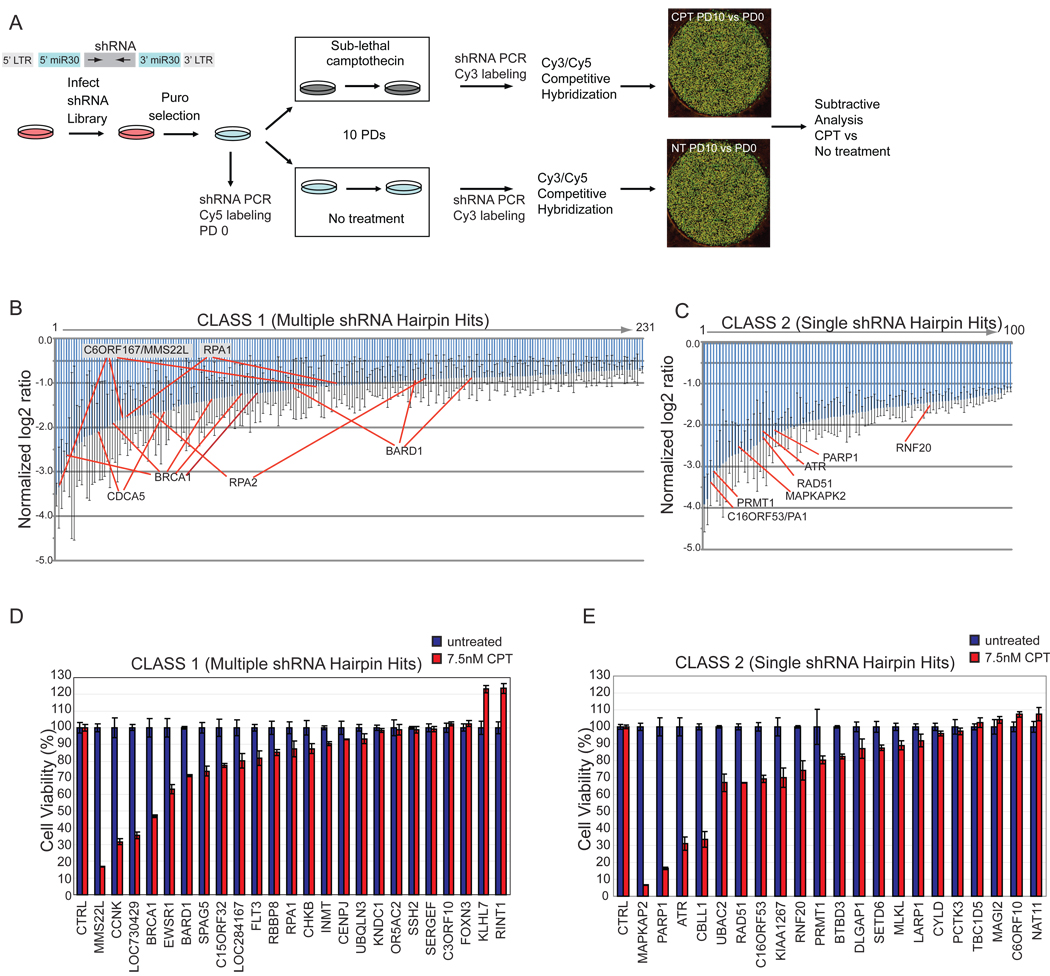
Figure 1. A genome-wide shRNA screen to identify genes necessary for resistance to CPT.
(A) Schematic of the primary screen.
(B, C) Normalized log2 ratios for candidate genes. Error bars indicate the standard error of the mean for triplicate hybridization signals for each shRNA. Individual shRNAs for selected genes are indicated.
(D, E) MCA in HeLa cells transduced with shRNAs targeting the indicated Class 1 (panel D) or Class 2 (panel E) genes with or without CPT (7.5 nM). Error bars represent standard deviation (STDEV) for triplicate assays.

