Fig. 10.
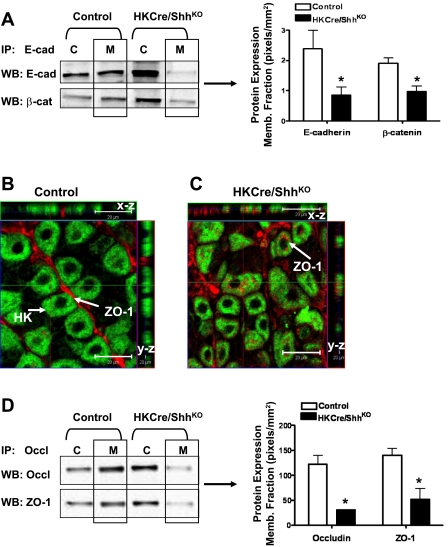
Expression of E-cadherin and ZO-1 in control and HKCre/ShhKO mouse stomachs. A: lysates were collected from control and HKCre/ShhKO mouse stomachs, and cytoplasmic (C) and membrane (M) protein extracts were prepared, immunoprecipitated by use of anti-E-cadherin antibody, and immunoblotted for E-cadherin and β-catenin protein expression. E-cad and β-cat protein expression was quantified by the Odyssey Infrared Imaging System software. Data are shown as means ± SE for 4 mice/group and expressed as pixels/mm2. Confocal images of immunofluorescence staining for H+-K+-ATPase (HK, Alexa Fluor 488, green) and ZO-1 (Alexa Fluor 633, red) in 8-mo-old (B) control and (C) HKCre/ShhKO mice. Representative of n = 8 per group. Arrows in B show apical-expressed ZO-1. Arrows in C show ZO-1 predominantly expressed in cytoplasm. Optical sections spaced 1 μm in the z-axis of section (x-z and y-z). The green line in the x-y image is the location of the x-z slice. The red line in the x-y image is the location of the y-z slice. D: lysates were collected from control and HKCre/ShhKO mouse stomachs and cytoplasmic and membrane protein extracts prepared, and immunoprecipitated using anti-occludin (Occl) antibody and immunoblotted for Occl and ZO-1 protein expression. Occludin and ZO-1 protein expression was quantified by the Odyssey Infrared Imaging System software. Data are shown as means ± SE for 4 individual mice/group and expressed as pixels/mm2.

