
Fig. 7.
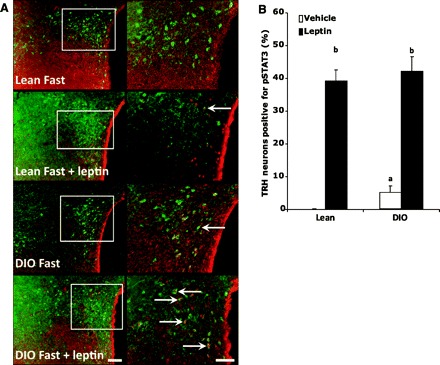
The magnitude of leptin-induced increase of pSTAT3 in TRH neurons is the same in both DIO and lean rats. Brain sections of fasted (48 h) and fasted/leptin-treated (3.5 μg/rat icv 30 min) rats were subjected to double immunohistochemistry using anti-pSTAT3 (brown staining) and anti-pro-TRH (red fluorescent staining) antiserum. A: low-magnification images for each individual staining for each group on the left and high-magnification merged images on the right. Arrows point to dual-labeled cells. Scale bars, 50 (low magnification) and 20 μm (high magnification). B: number of TRH neurons positive for pSTAT3 in lean vs. DIO rats when treated with leptin icv. The statistics were done by counting >50 fields/condition.