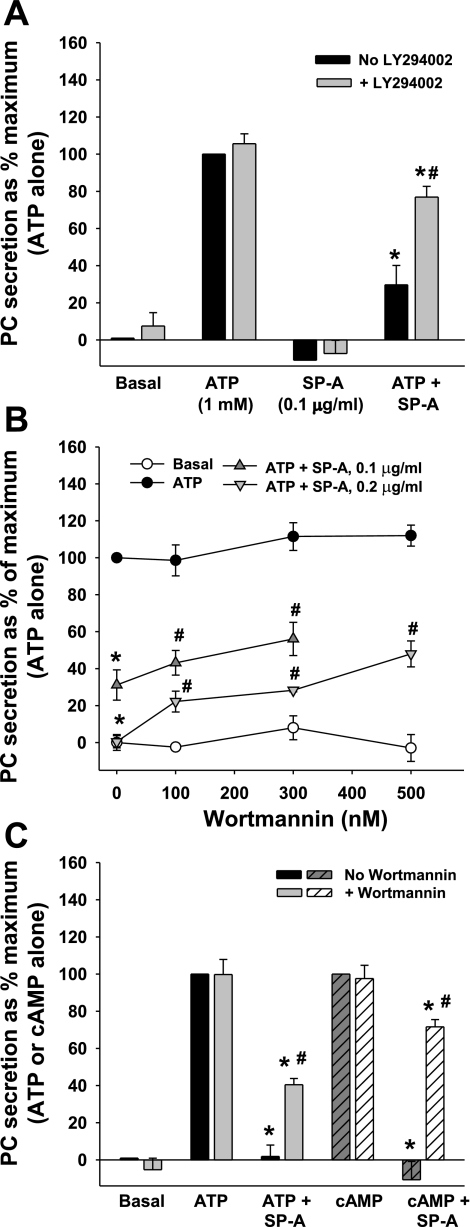
Fig. 5.
Inhibition of PI3-kinase partially reverses the ability of SP-A to inhibit PC secretion. A: LY-294002, ATP, cells on dishes. Type II cells were incubated with [3H]choline overnight to label PC. Cells were washed and incubated without or with 1 mM ATP. LY-294002 (10 μM) and SP-A (0.1 μg/ml) were added at 30 and 15 min, respectively, before the addition of ATP. Secretion was measured over 1 h. Data are means ± SE of duplicate or triplicate samples from 3 experiments. *Significant difference from ATP; #significant difference from ATP + SP-A, no LY-294002. P < 0.05; n = 3. B: wortmannin, ATP, cells on dishes. Type II cells were plated on plastic dishes and incubated with [3H]choline overnight to label PC. After 24 h, the cells were washed and incubated without or with 1 mM ATP. Wortmannin (0–500 nM) and SP-A (at either 0.1 or 0.2 μg/ml) were added at 30 and 15 min, respectively, before the addition of ATP. Secretion was measured over 1 h. Data are means ± SE of duplicate or triplicate samples from 4 to 6 experiments. Control values for each experiment were subtracted, and data are expressed as a percentage of maximum stimulation by 1 mM ATP (100%). Control or ATP-stimulated PC secretion is 2.2 ± 0.3 or 5.5 ± 0.4% (mean ± SE, n = 6), respectively. *Significant difference from ATP; #significant difference from ATP + SP-A, P < 0.05; n = 3. C: wortmannin, ATP or cAMP, cells on membranes. Cells were plated on Transwell membranes. After 24 h, the cells were washed and incubated without or with 1 mM ATP or 0.1 mM cAMP. Wortmannin (300 nM) and SP-A (at 0.1 μg/ml) were added at 30 and 15 min, respectively, before the addition of ATP or cAMP. Secretion was measured over 1 h. Data are means ± SE of duplicate or triplicate samples from 3 to 7 experiments. Control values for each experiment are subtracted, and data are expressed as a percentage of maximum stimulation by 1 mM ATP or cAMP (100%). Control or ATP-stimulated PC secretion was 2.5 ± 0.2 or 4.7 ± 0.3%, respectively (mean ± SE, n = 3). Control or cAMP-stimulated PC secretion was 2.8 ± 0.6 or 5.2 ± 1.1% (mean ± SE, n = 4), respectively. *Significant difference from secretagogue-stimulated values; #significant difference from ATP + SP-A or cAMP + SP-A, P < 0.05; n = 3 or 4.

