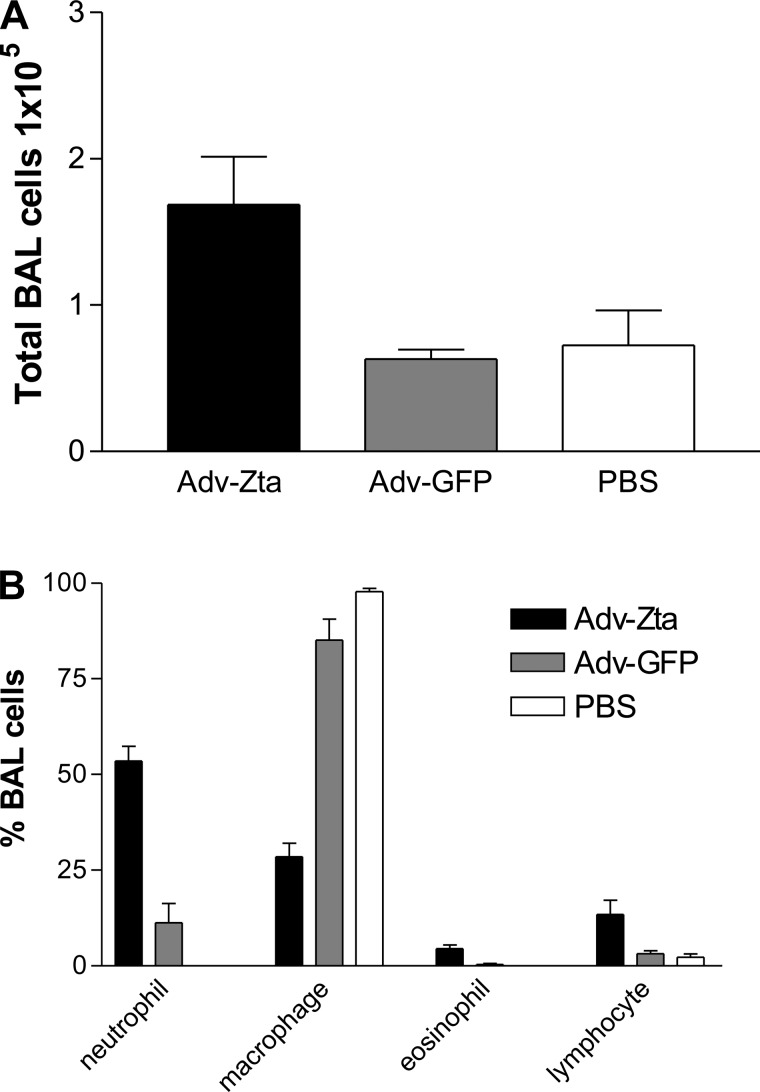
Fig. 3.
Enhanced inflammation in Adv-Zta-treated mice. BAL fluid was prepared from mice harvested on day 7 postexposure to Adv-Zta, Adv-GFP, or vehicle (PBS). A: total cell counts recovered by BAL. The graph shows the total number (mean ± SE) of live cells (trypan blue exclusion) as determined by direct counting with a hemacytometer in the BAL fluid recovered from mice in the indicated treatment groups. Adv-Zta, black bars, n = 9; Adv-GFP, gray bars, n = 10; PBS, white bars, n = 4. Adv-Zta vs. Adv-GFP, P = 0.0003; Adv-GFP vs. PBS, P = 0.7234. B: differential cell counts of BAL cells. Cytospin samples of the cells recovered by BAL were stained with Diffquik. Cells were visualized by microscopy, and 100 cells were counted from each sample. The graph shows the percentage of the indicated cell type (mean ± SE) in the cells recovered from the BAL fluid from mice treated with Adv-Zta, black bars, n = 9; Adv-GFP, gray bars, n = 10; and PBS, white bars, n = 4. Neutrophil cell count Adv-Zta vs. Adv-GFP, P < 0.0001; lymphocyte cell count Adv-Zta vs. Adv-GFP, P = 0.0535.

