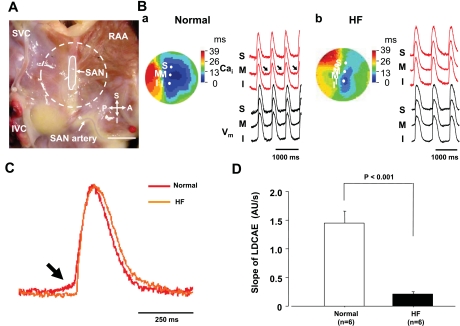
Fig. 3.
Activation patterns of SAN in normal and HF RAs. A: photo of isolated RA preparation showing the SAN and surrounding RA. Gray area is the SAN. Dotted circle corresponds to isochronal map field in B. B: activation pattern of the SAN and surrounding RA in normal (a) and HF (b) dogs. Color pictures show isochronal maps of membrane potential (Vm) propagation. Intracellular Ca2+ (Cai2+; red) and Vm (black) recordings from superior (S), middle (M), and inferior (I) SAN are presented. Arrows represent enhanced late diastolic Ca2+ elevation (LDCAE). C: magnified view of Cai2+ tracing at pacemaking site in SAN. Arrow shows difference between normal and HF in LDCAE. D: slope of LDCAE on pacemaking site in normal and HF dogs. Slope is significantly suppressed in HF (P < 0.001). P, posterior; A, anterior; AU, arbitrary units. Bar is 10 mm.

