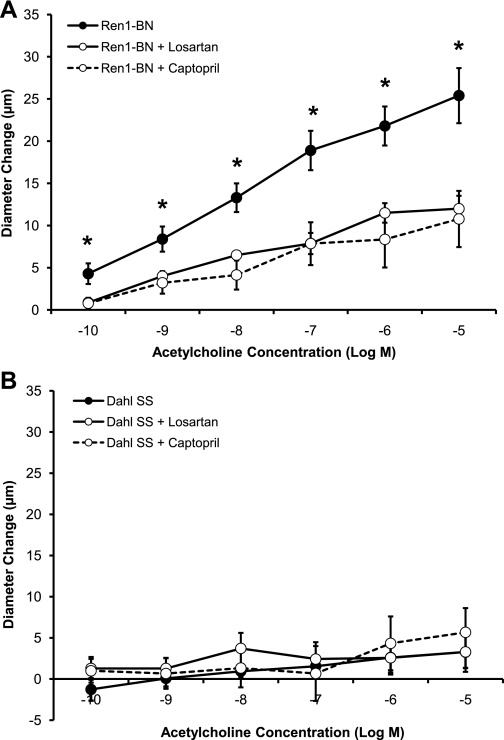
Fig. 11.
A: response of isolated middle cerebral arteries of Ren1-BN rats (n = 10) to acetylcholine (10−10-10−5 M) ± 3-day treatment with captopril (100 mg·kg−1·day−1; n = 7) or ± 7-day treatment with losartan (20 mg·kg−1·day−1; n = 8). *Significant difference (P < 0.05), Ren1-BN + losartan and Ren1-BN + captopril vs. Ren1-BN control. The Ren1-BN control response is replotted from Fig. 3. B: response of isolated middle cerebral arteries of Dahl SS rats (n = 9) to acetylcholine (10−10-10−5 M) ± 3-day treatment with captopril (100 mg·kg−1·day−1; n = 6) or ± 7-day treatment with losartan (20 mg·kg−1·day−1; n = 7). The Dahl SS control response is replotted from Fig. 3. Values are mean change in diameter from baseline ± SE in μm.

