Fig. 2.
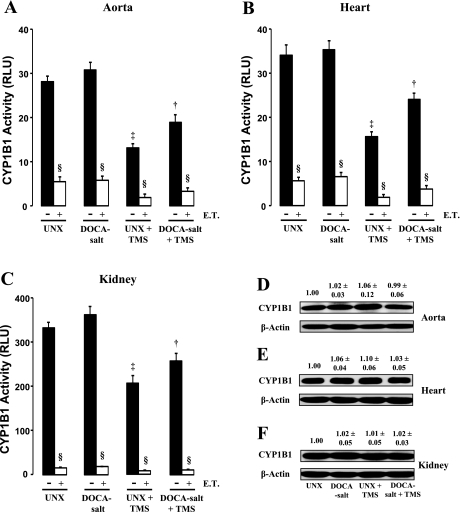
TMS attenuates cytochrome P-450 1B1 (CYP1B1) activity without altering its expression. The effect of TMS on CYP1B1 activity in aorta (A), heart (B), and kidney (C) is shown. Tissues were isolated from rats in the various treatment groups and homogenized, and CYP1B1 activity was measured using the P450-Glo assay kit as recommended by supplier (materials and methods). Luminescence was measured using a luminometer and expressed as relative luminescence units (RLU). Samples were also incubated with exogenous TMS (E.T.; 6 μmol/l) for 30 min to determine any further effect of TMS on CYP1B1 activity. CYP1B1 protein expression was measured in the aorta (D), heart (E), and kidney (F) of animals from the various treatment groups by Western blot analysis as described in materials and methods. The blots were probed with anti-CYP1B1 antibody. Density of the bands was analyzed using ImageJ 1.42 software and expressed as the ratio of CYP1B1 to β-actin protein. Data are means ± SE (n = 3–5). ‡P < 0.05, UNX vs. UNX + TMS. †P < 0.05, DOCA-salt vs. DOCA-salt + TMS. §P < 0.05, E.T. vs. corresponding treatment group.

