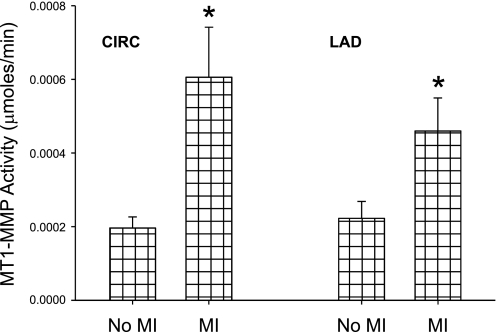
Fig. 4.
MT1-MMP fluorogenic activity at baseline. In both the CIRC (initial MI) and LAD (targeted for I/R) regions, baseline MT1-MMP activity was elevated in the animals with previous MI compared with the animals without previous MI. Values are means ± SE; sample size was n = 14 in the no MI group and n = 16 in the MI group. *P < 0.05 vs. the no MI group.

