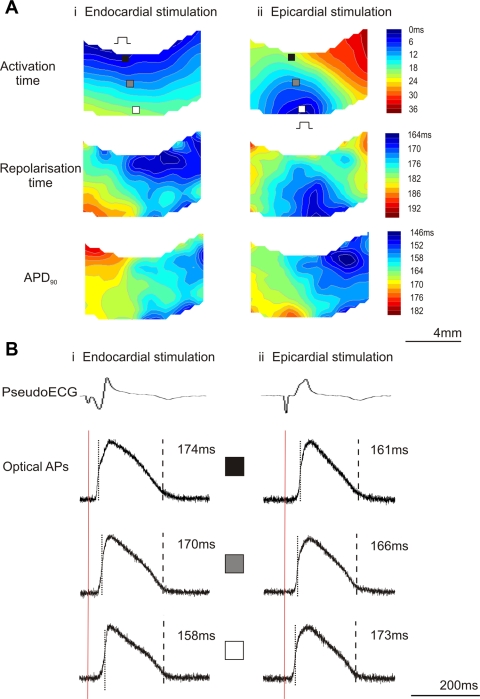
Fig. 3.
Transmural APs during endocardial and epicardial stimulation. A: contour maps of transmural activation time (AT), repolarization time (RT), and action potential duration at 90% repolarization (APD90) during endocardial (i) and epicardial (ii) stimulation. B: pseudoECG and single-pixel optical AP traces during endocardial (i) and epicardial (ii) stimulation. Optical APs were sampled from the pixels indicated: subendocardium (black), midmyocardium (grey), and subepicardium (white). Stimulus (red line), AT (dotted line), and RT (dashed line) and APD90 are given.

