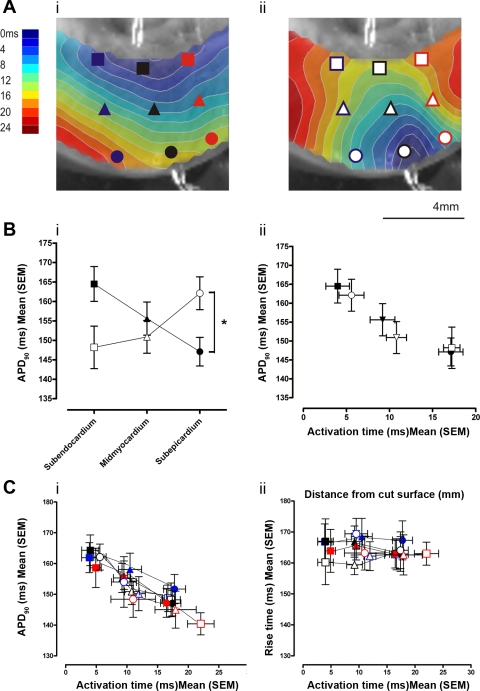
Fig. 4.
Relationship between activation time and action potential duration. A: isochronal maps of transmural AT superimposed on a plain image of the transmural surface with optical AP sampling points for the mid LV free wall (black), compared with basal (blue) and apical (red) LV. B: mean APD90 in the subendocardium (■, □), midmyocardium (▴, ▵), and subepicardium (●, ○) during endocardial (■, ▴, ●) and epicardial stimulation (□, ▵, ○), plotted against transmural position (i) and AT (ii). *P < 0.05. C: APD90 (i) and RT (ii) from each area plotted as a function of AT.

