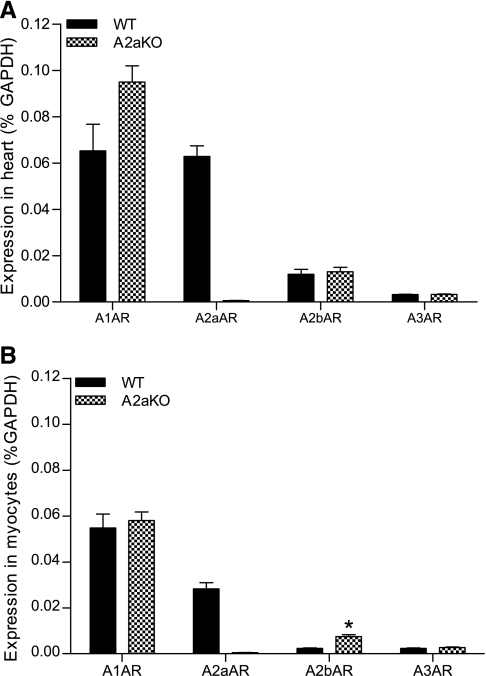
Fig. 5.
AR gene expression in the murine myocardium (A) and ventricular cardiomyocytes (B) of WT and A2aKO hearts. Relative AR gene expression was assessed by real-time PCR in mouse ventricles and isolated, enriched ventricular myocyte preparations. All data were normalized to GAPDH and are expressed as a percentage of GAPDH. Data are means ± SE; n ≥ 3. *Statistically significant difference from the heart at P < 0.05.

