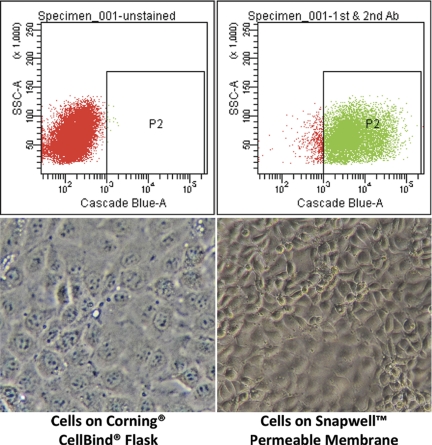
Fig. 1.
Isolation of cortical collecting duct (CCD) cells by flow cytometry. Top left: unstained cell fluorescence dot plot. Top right: Dolichos biflorus agglutinin (DBA)-stained cells showed a shift in fluorescence that is separate from unstained cells, and FACSAria software was gated to select the DBA-positive cells. Bottom left: brightfield image of mouse telomerase reverse transcriptase (mTERT)-CCD cells grown on glass at passage 25 (×20 objective with ×10 camera zoom). Bottom right: brightfield image of mTERT cells grown on Snapwell membranes at passage 30 (×20 objective with ×10 camera zoom) showing typical epithelial cell morphology.

