Fig. 4.
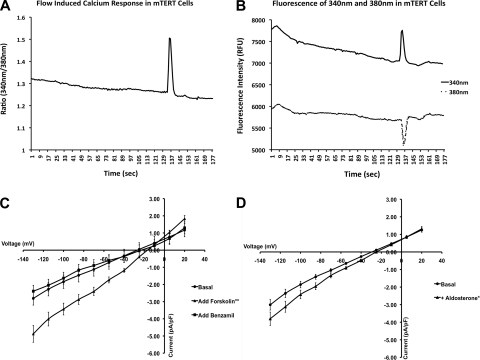
Functional characterization of mTERT-CCD cells. A: spike in the 340/380-nm fura 2 ratio in response to an increase in laminar flow from 0.5 to 5 ml/min at the apical membrane. B: decrease in 380-nm and increase in 340-nm fluorescence intensities indicating a calcium response. C: comparison of whole cell currents in mTERT-CCD cells with no treatment, after stimulation with forskolin, and subsequent blockade by benzamil. Each current was normalized by its cell capacitance. Average cell capacitance was 26.05 ± 3.28 pF; n = 4. **P < 0.0001 (error bars represent SE). D: aldosterone stimulation of mTERT-CCD cells. Whole cell currents of mTERT-CCD cells after administration of aldosterone for 6 days compared with cells without aldosterone treatment. Each current was normalized by its cell capacitance. Average cell capacitance was 26.79 ± 2.74 pF; n = 4. *P < 0.0001 (error bars represent SE).

