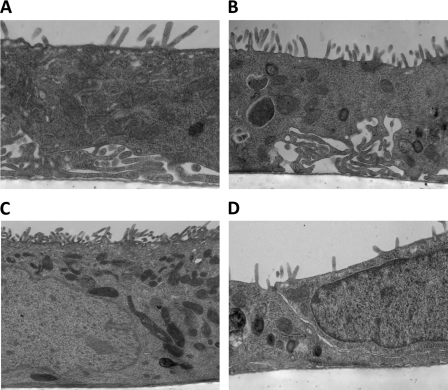
Fig. 5.
Characterization of transepithelial Na+ transport by transmission electron microscopy. A: control (no treatment). Magnification ×6,500. B: 6 days of aldosterone treatment. Magnification ×4,400. C: 6 days of aldosterone treatment in the presence of amiloride. Magnification ×2,700. D: amiloride treatment alone. Magnification ×4,400.

