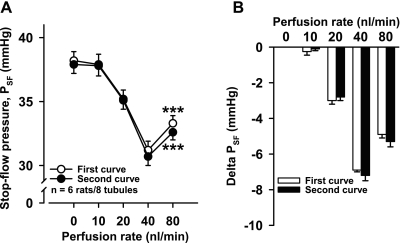
Fig. 1.
A: two consecutive stop-flow pressure (PSF) curves were induced by increasing the late proximal tubule perfusion rate (0, 10, 20, 40, 80 nl/min), which lowered PSF. However, at 80 nl/min, PSF increased (***P < 0.001, 80 vs. 40 nl/min), indicating afferent arteriole (Af-Art) dilatation. There was no difference between the first (○) and second (●) curve. B: delta PSF (calculated by taking each PSF at 0, 10, 20, 40, and 80 nl/min and subtracting PSF at 0 nl/min).

