Fig. 3.
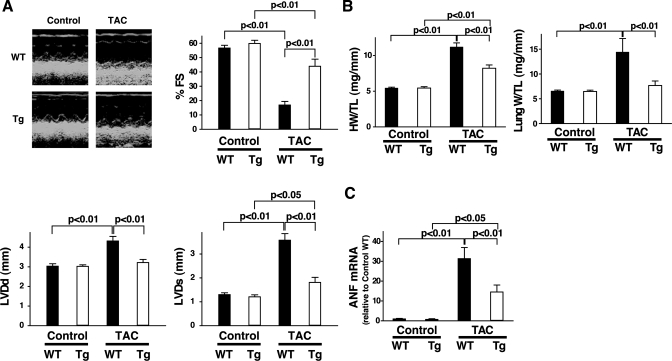
Pressure overload increased cardiac hypertrophy in mTOR-Tg mice. A: echocardiographic analyses. Left, representative M-mode images of nonoperated (control) and transverse aortic constriction (TAC)-operated mTOR-Tg and WT mice. Right, mean scores for %fractional shortening (%FS), left ventricular (LV) diameter in systole (LVDs), and left ventricular diameter in diastole (LVDd). Values are means ± SE; n = 6 in each group. B: ratios of heart weight to tibia length (HW/TL; left) and lung weight to tibia length (LW/TL; right). Hearts and lungs from each group were harvested after echocardiography was performed. Values are means ± SE; n = 6 in each group. C: fold changes in atrial natriuretic factor (ANF) mRNA levels. Ventricular ANF mRNA levels were quantified with QRT-PCR. Values are means ± SE; n = 6 in each group.

