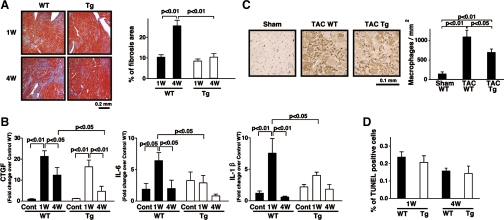
Fig. 5.
Interstitial fibrosis and inflammatory response in mTOR-Tg mice after LV pressure overload. A: pathological analysis. Left, representative photos of Masson's trichrome staining in cardiac sections from TAC-operated WT and Tg mice at 1 and 4 wk post-TAC; right, quantitative analysis of interstitial fibrosis examined by Masson's trichrome staining (n = 3 in each group). B: expression of mouse connective tissue growth factor (CTGF), IL-6, and IL-1β mRNAs. mRNA was measured by QRT-PCR. Values are means ± SE; n = 4–6 in each group. C: macrophage infiltration. Left, representative photos of anti-Mac-2 immunostained hearts from sham control, TAC-operated WT, and TAC-operated mTOR-Tg mice. Macrophages are stained brown. Right, quantitative analysis of macrophage infiltration. Macrophages were counted in hearts from several animals in each group (sham, n = 3; 1 wk post-TAC, n = 4; 4 wk post-TAC, n = 4). D: terminal deoxynucleotidyl transferase dUTP nick-end labeling (TUNEL) assay. Apoptotic cells have TUNEL-positive nuclei. Values are means ± SE; the percentage of TUNEL-positive nuclei was calculated from over 6,000 nuclei in each group.

