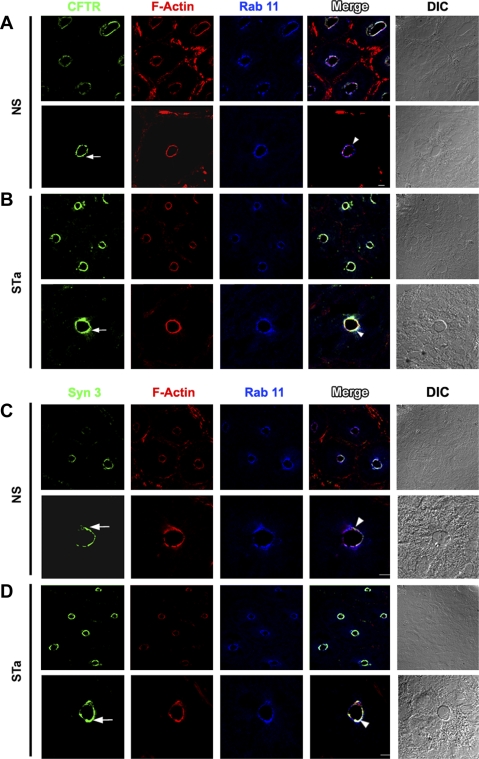
Fig. 6.
Apical distribution of CFTR, syntaxin 3, and rab11 in rat jejunum after heat-stable enterotoxin (STa). Cryostat sections of rat jejunum treated with normal saline (NS) or STa were immunolabeled and examined by confocal microscopy as described in materials and methods. Low- and high-magnification images of crypt sections are shown. Images of immunolabeled sections from rat jejunum after NS (A and C) or STa (B and D) show the distribution of CFTR (green, arrow, A and B), F-actin (red, A–D), rab11 (blue, A–D), and syntaxin 3 (green, arrow, C and D). Merged images show areas of colocalization (white; arrowhead). DIC, differential interference contrast. Scale bars, 10 μm and 100 μm.

