
Figure 2.
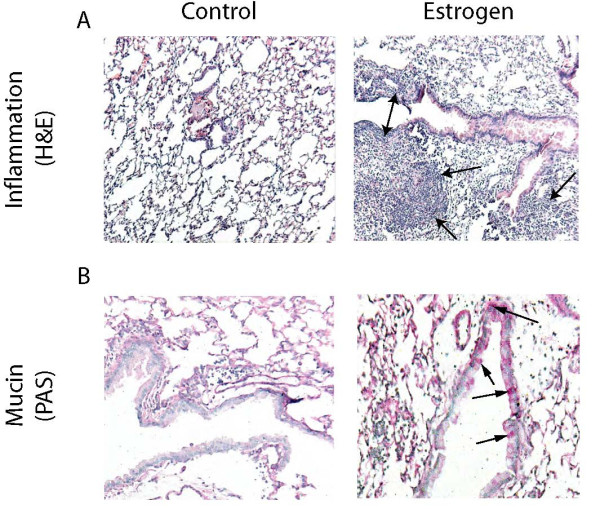
E2 treatment is correlated with an increase in inflammatory infiltrate and mucin in lung tissue sections. In lung tissue sections, E2 treated mice had (A) H&E stain: inflammatory infiltrate (arrows) and (B) PAS stain: mucin producing airway lining cells (Pink, arrows). Controls showed much less inflammatory infiltrates or mucin producing cells. Light microscopy, original magnification X 100, n = 4.