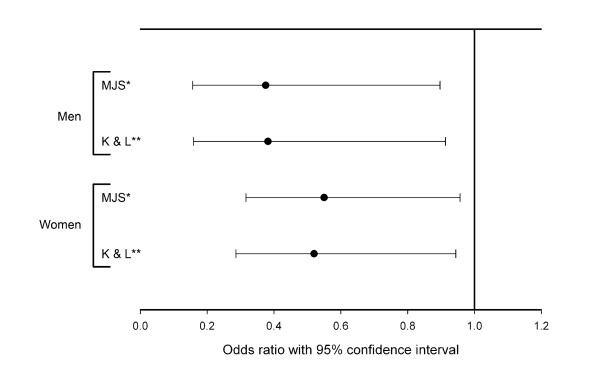
Figure 3.
Age adjusted odds ratio for having hip OA in the contralateral hip of hip fracture cases compared to controls without hip fracture. Error bars show 95% CI for cases compared to controls. MJS: Using hip OA defined by minimal joint space. K & L: Using hip OA defined by Kellgren and Lawrence grade.

