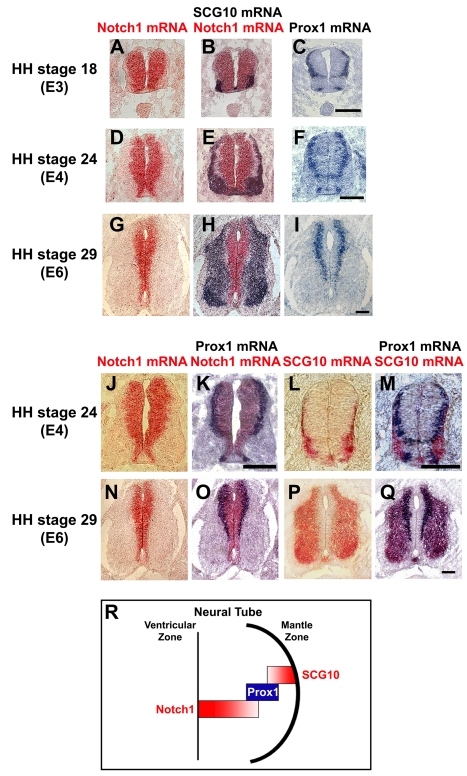
Figure 1. Comparison of spatiotemporal expression patterns of Prox1, Notch1, and SCG10 genes in early embryonic chick spinal cord.
(A–I) Double in situ hybridizations with Notch1 (red) and SCG10 (blue) on sections from HH stages 18 (A–B), 24 (D–E), and 29 (G–H), and comparison with Prox1 (C, F, and I) single in situ hybridizations on adjacent sections. The sections were from the thoracic level of spinal cord. (J–Q) Double in situ hybridizations with Notch1 (red) and Prox1 (blue) on sections from HH stages 24 (J–K, thoracic level) and 29 (N–O, thoracic level), and double in situ hybridizations with SCG10 (red) and Prox1 (blue) on sections from HH stages 24 (L–M, cervical level) and 29 (P–Q, thoracic level). Scale bars: 100 µm. (R) Schematic representation of the Prox1 expression pattern in neural tube during early embryonic development.

