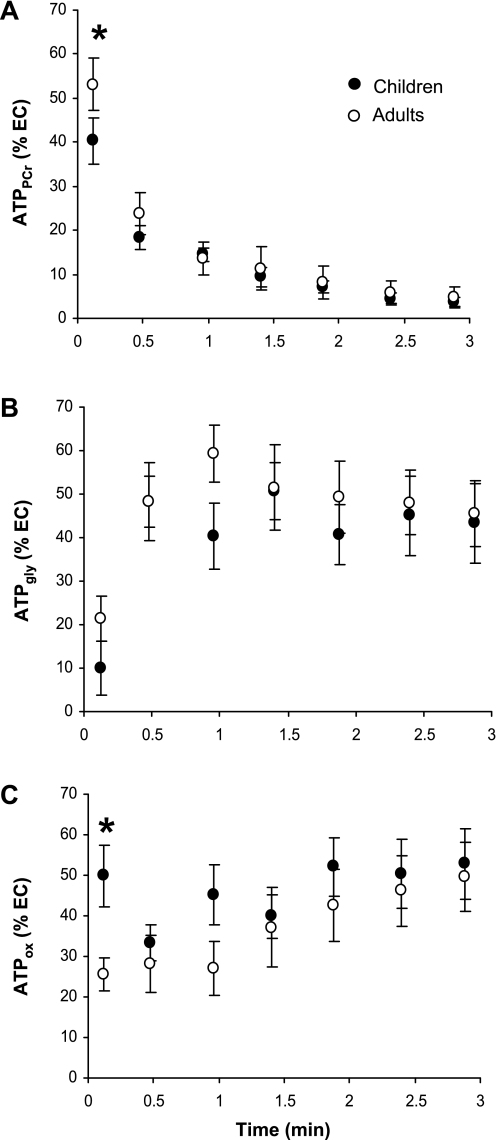
Fig. 3.
Relative contributions of PCr (ATPPCr; A), anerobic glycolysis (ATPgly; B), and oxidative phosphorylation to the total ATP turnover (ATPox; C). Values are expressed as percentage of the standardized energy cost (EC) calculated as the total ATP synthesis rate related to the power output-to-muscle volume ratio at each time point. *Significant difference between children and men (P < 0.05).

