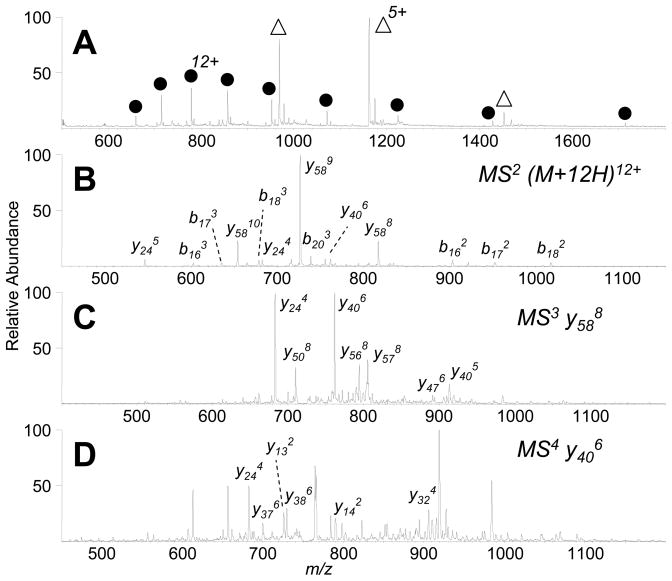
Figure 6.
IR-ELDI-MS and MSn of bovine ubiquitin. (A) IR-ELDI-MS of a mixture of 2 μL ubiquitin (peaks labeled with ●) and insulin (peaks labeled with △), 100 μM and 300 μM, respectively. (B) MS2 analysis of the 12+ ubiquitin ion (m/z 714). (C) MS3 of y588 ion (m/z 817). (D) MS4 analysis of y406 ion (m/z 761).

