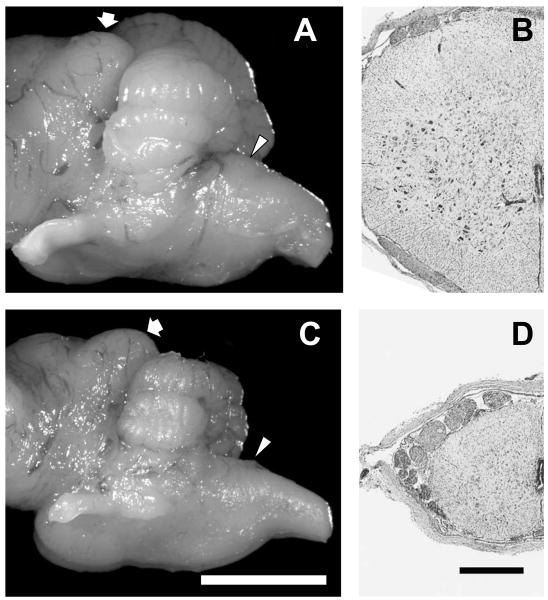
Figure 2.
Cerebellar and spinal cord hypoplasia. Panels A and C show the left lateral view of cerebellum and brainstem of a newborn normal pup and an affected littermate, respectively. In each panel the fat arrow indicates the caudal colliculus, and the arrowhead indicates the obex (bar in panel C = 5 mm, and panels A and C are presented at the same total magnification). Panels B and D show cross-sections of spinal cord cervical segment 6 of a newborn normal pup and an affected littermate, respectively (bar in panel D = 500 μm, and panels B and D are presented at the same total magnification). There was a similar degree of hypoplasia throughout the length of affected pup spinal cord.

