
Figure 1. Genome-Wide Location Analysis in Human Embryonic Stem Cells.
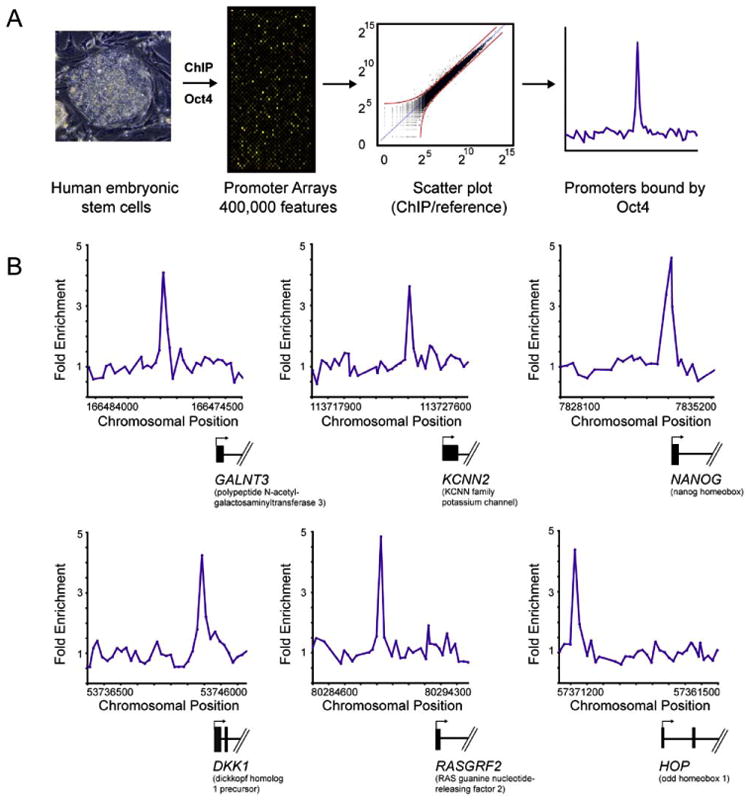
(A) DNA segments bound by transcriptional regulators were identified using chromatin immunoprecipitation (ChIP) and identified with DNA microarrays containing 60-mer oligonucleotide probes covering the region from −8 kb to +2 kb for 17,917 annotated transcription start sites for human genes. ES cell growth and quality control, ChIP protocol, DNA microarray probe design, and data analysis methods are described in detail in Experimental Procedures and Supplemental Data.
(B) Examples of OCT4 bound regions. Plots display unprocessed ChIP-enrichment ratios for all probes within a genomic region. Genes are shown to scale below plots (exons and introns are represented by thick vertical and horizontal lines, respectively), and the genomic region represented is indicated beneath the plot. The transcription start site and transcript direction are denoted by arrows.